When a datasheet says a fixture delivers 3,000 lumens, how do you know that number is real? In most cases, it was measured in an integrating sphere. This article explains what an integrating sphere is, what it is made of, and exactly how we use the one in our own lab to test LED fixtures — step by step, with the settings we use and the data you get at the end.
This article is part of our guide to LED Light Fixture Testing.
What Is an Integrating Sphere?
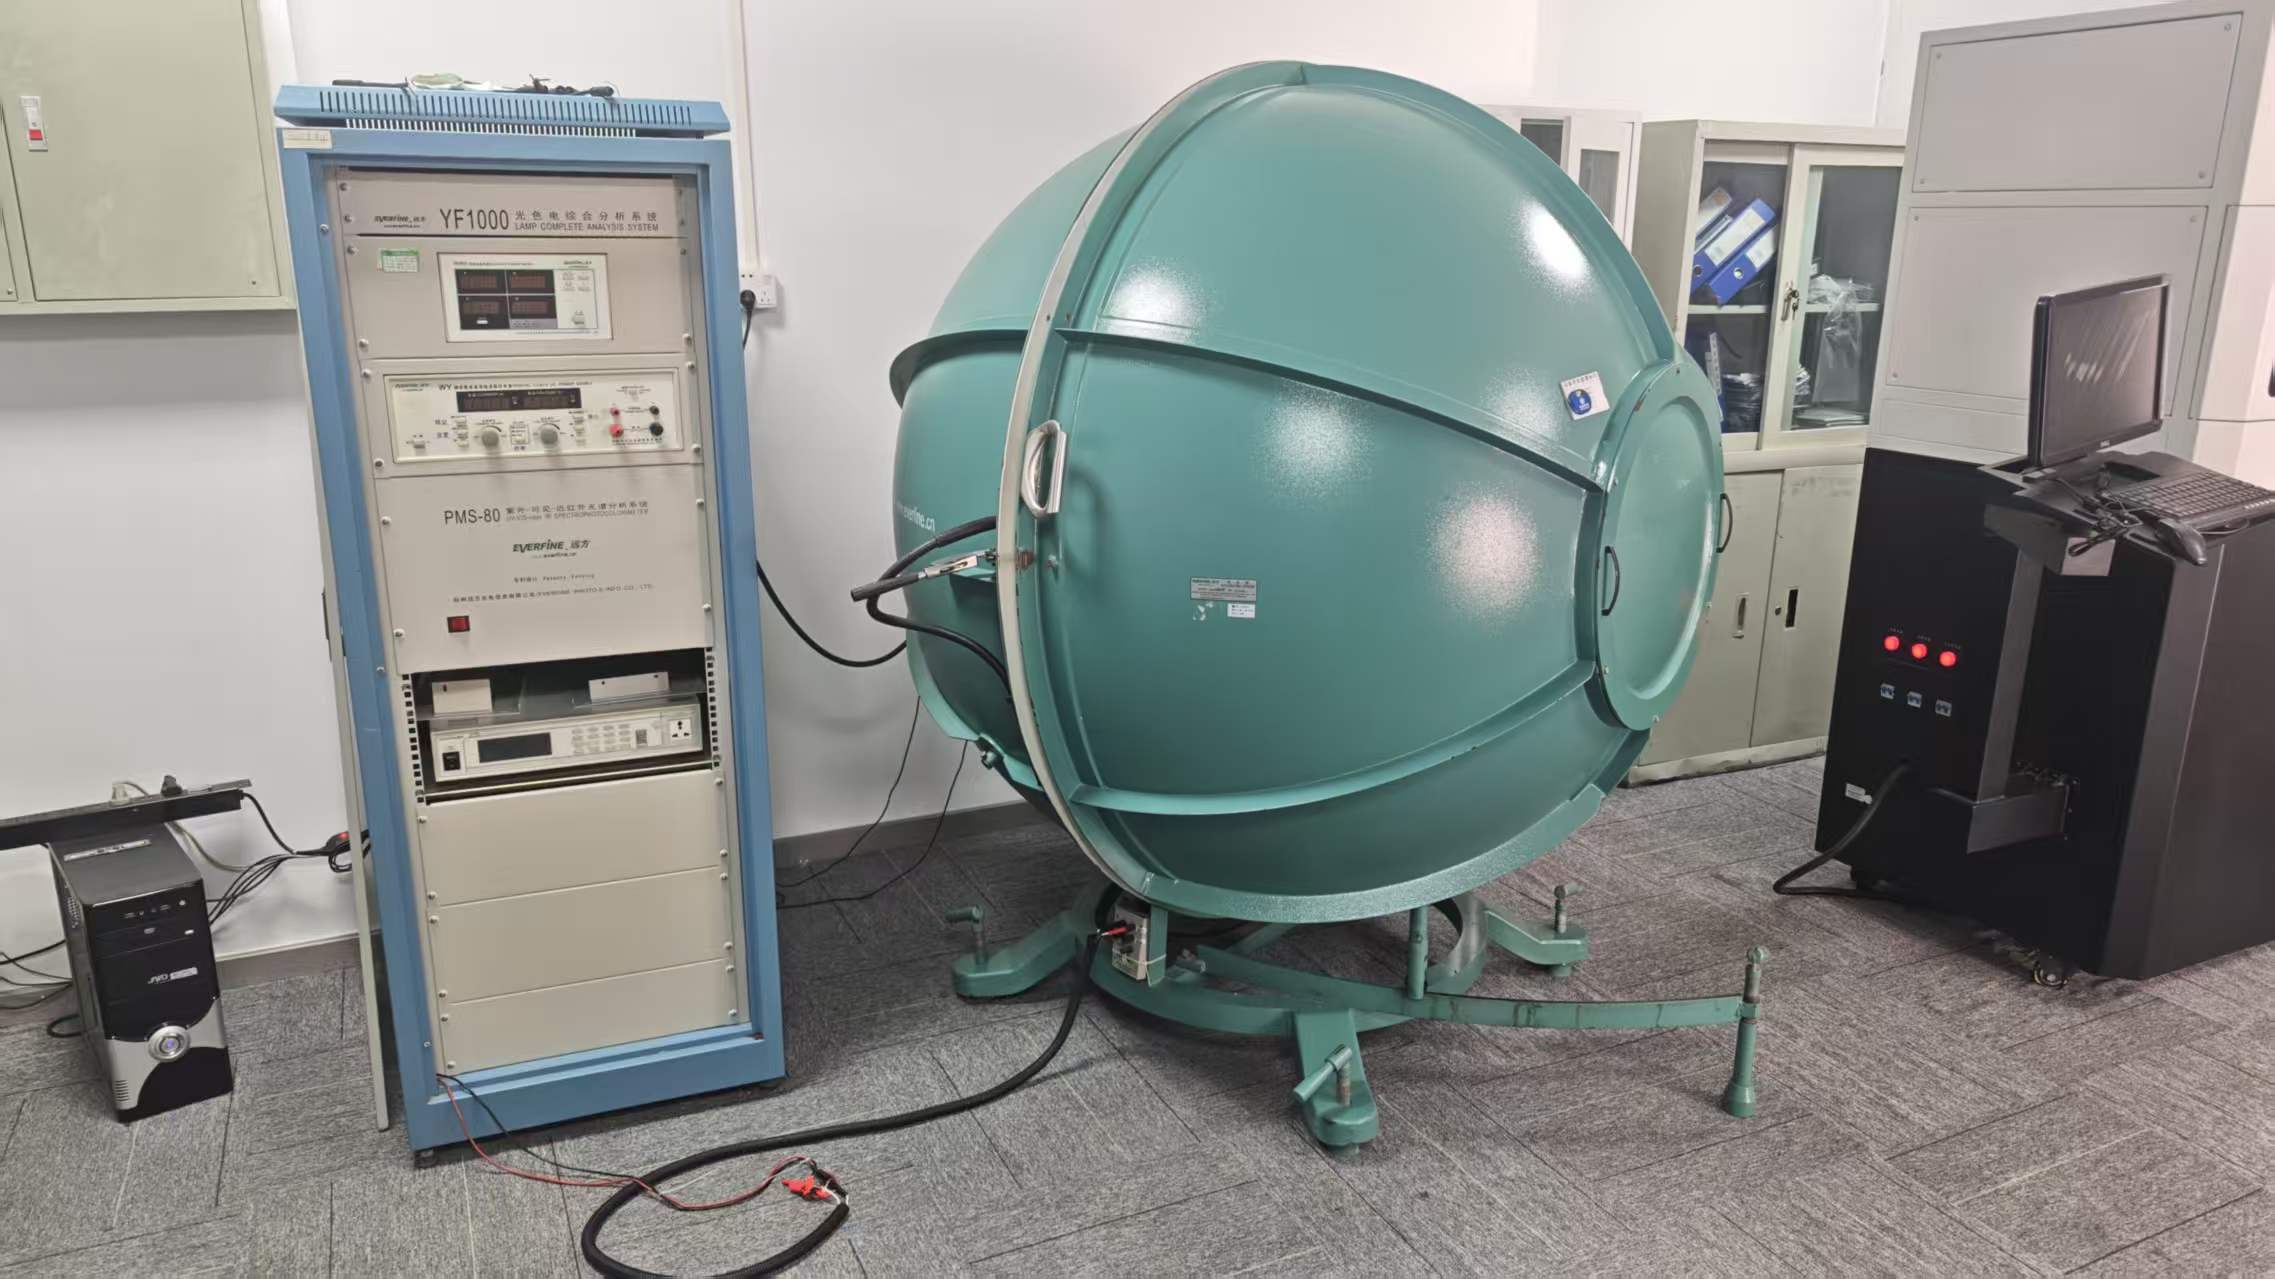
An integrating sphere is a hollow sphere whose inside wall is coated with a highly reflective, matte white material. Light from a fixture placed inside bounces off the wall many times until it is spread evenly across the whole surface.
Because the light is evenly mixed, a detector at one point on the wall can measure the total light the fixture emits in all directions. A small baffle stops light from hitting the detector directly, so the reading is not distorted by the fixture's beam.
The Two Parts of an Integrating Sphere System
An integrating sphere test system has two main parts that work together.
1. The sphere. This is the large ball you see in the photo. It opens in the middle so the fixture can be placed inside, and a fiber cable carries the light from the sphere to the measuring instruments.
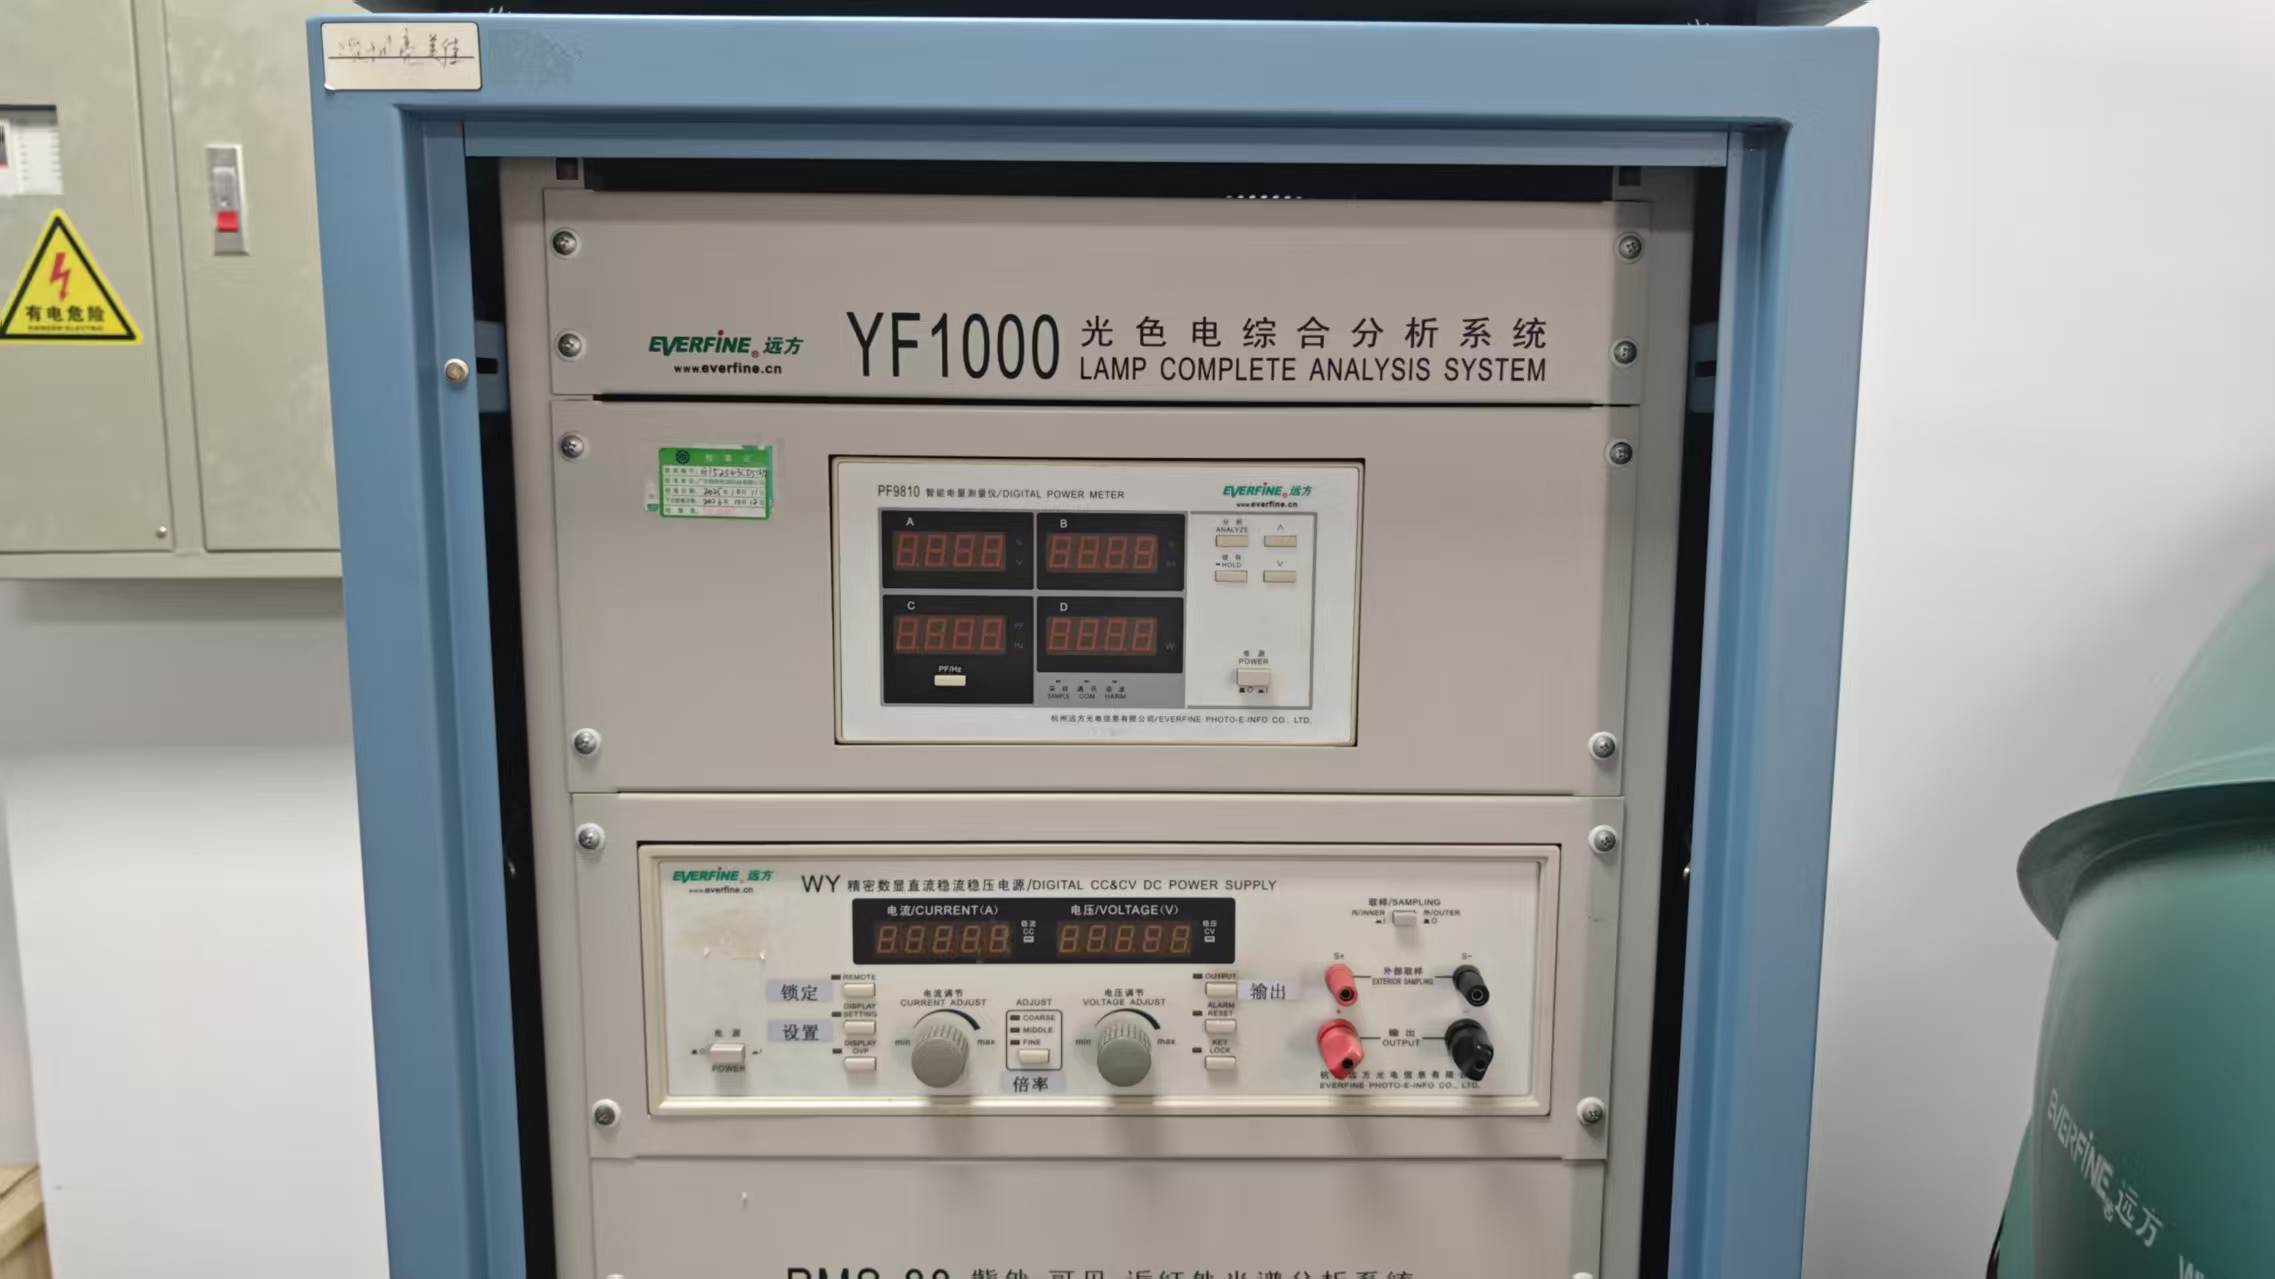
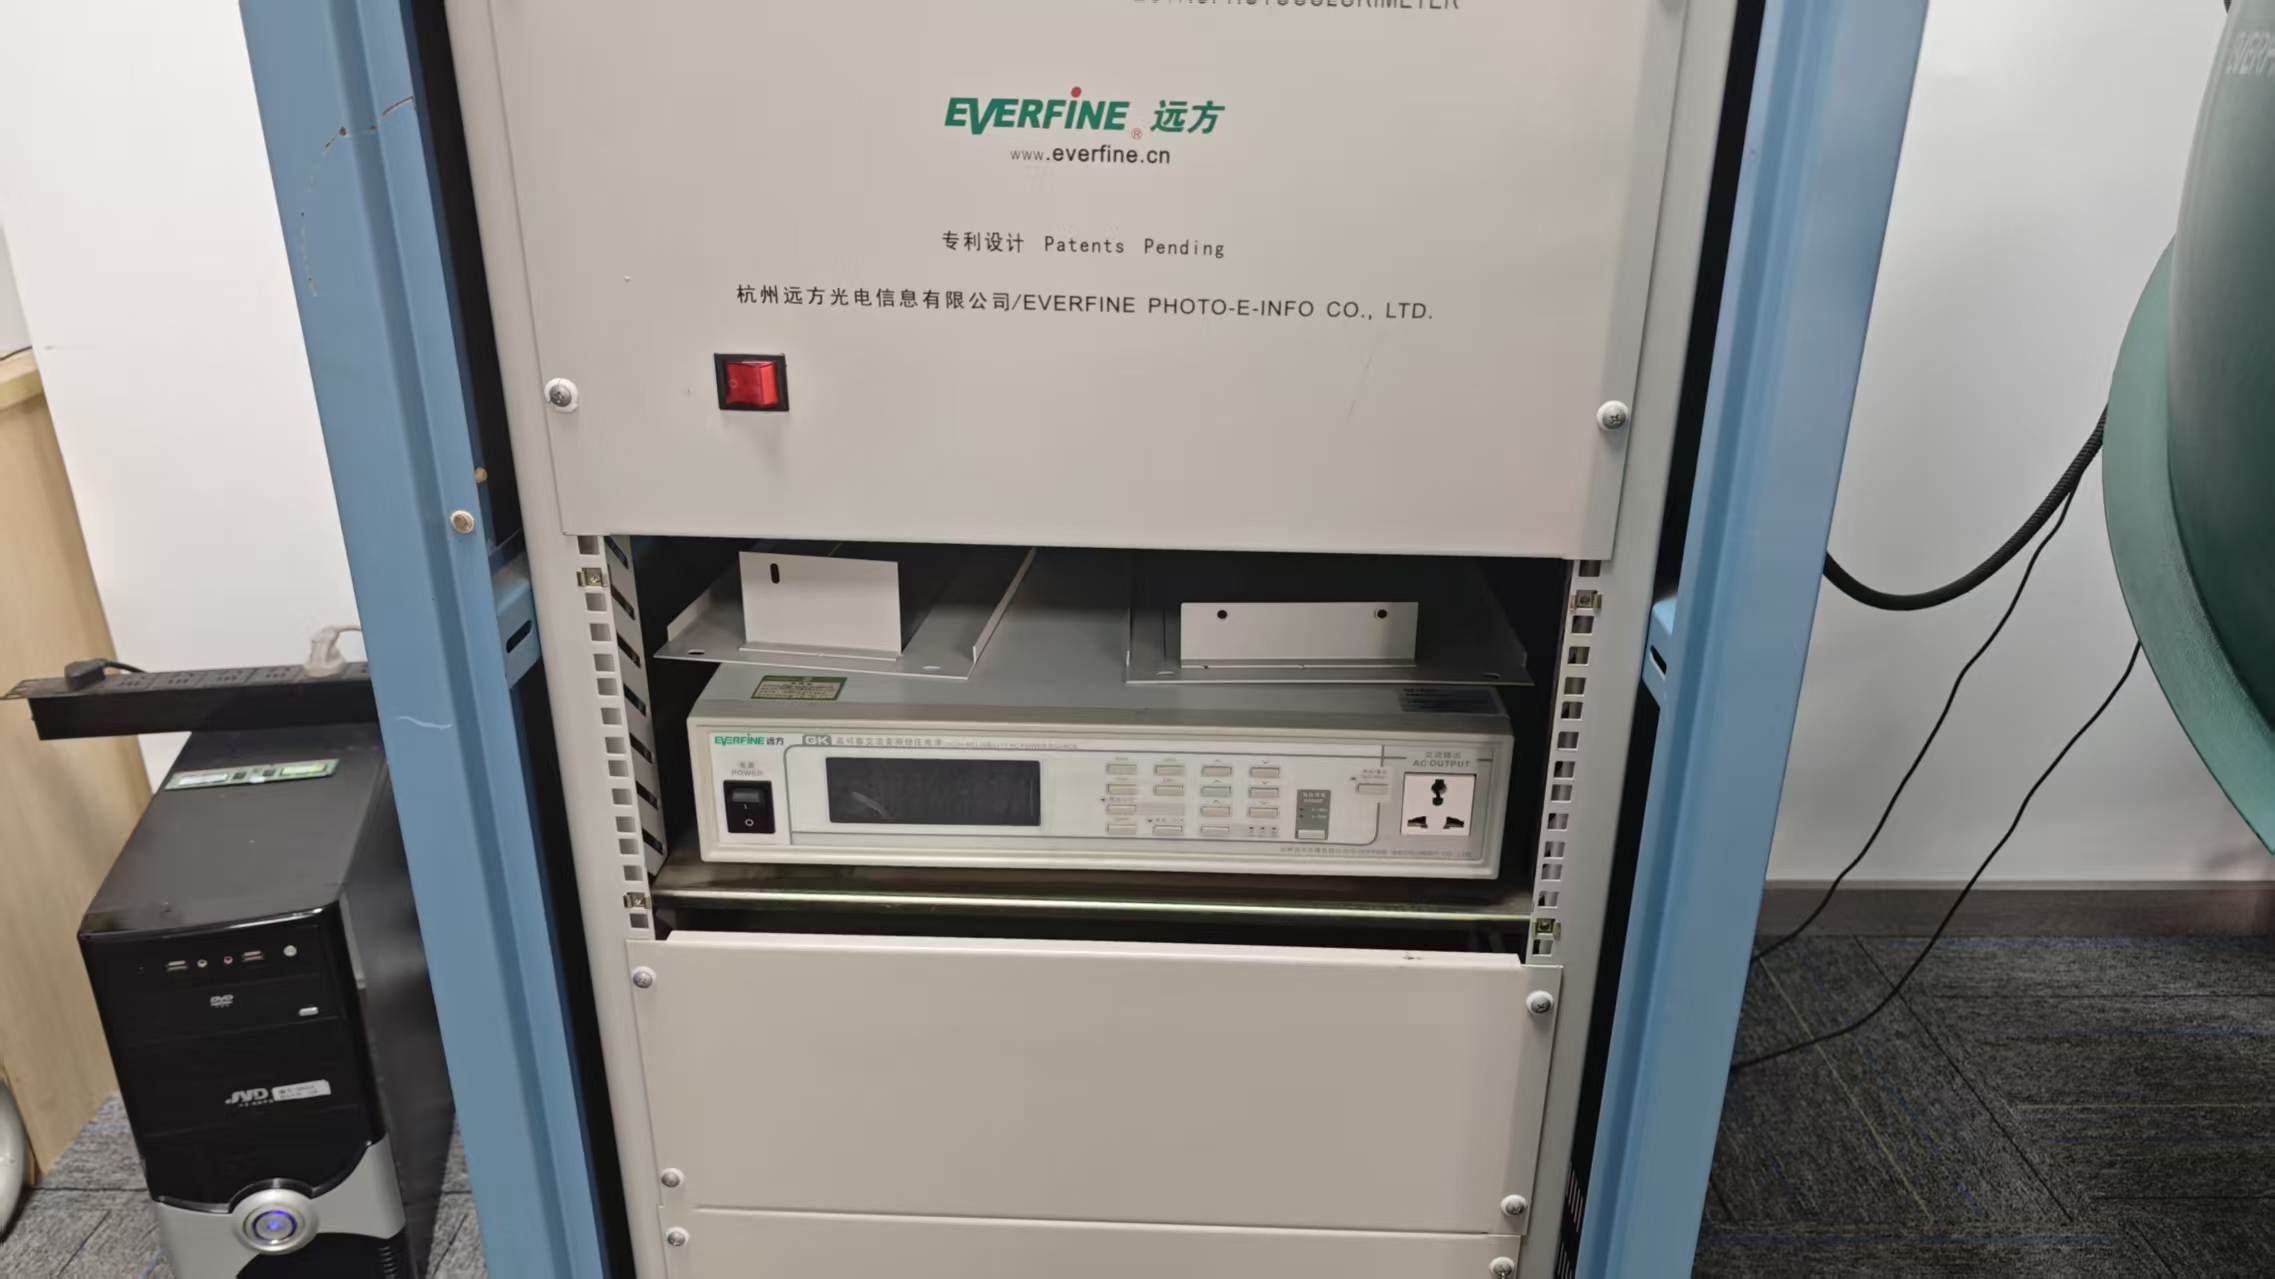
2. The measurement cabinet. This holds the instruments that power the fixture and read the results. Our lab uses an EVERFINE YF1000 Lamp Complete Analysis System, which includes:
|
Unit |
What it does |
|---|---|
|
Digital power meter |
Reads the fixture's voltage, current, power and power factor |
|
Precision DC power supply (constant current / constant voltage) |
Powers low-voltage fixtures, such as 24V DC products |
|
Spectroradiometer (UV–visible–near infrared) |
Analyses the light spectrum to calculate lumens and color data |
|
AC power source |
Powers high-voltage (mains) fixtures |
The cabinet is split by voltage. The upper section is used for low-voltage fixtures, and the lower section is used for high-voltage fixtures. A computer next to the system runs the test software and exports the results.
How We Test an LED Fixture in the Integrating Sphere: Step by Step
Step 1: Check whether the fixture is low voltage or high voltage
Before anything else, we confirm the fixture's input. Low-voltage fixtures, such as 24V DC linear lights and wall washers, are powered from the DC supply in the upper section. High-voltage fixtures that run directly on mains power are powered from the AC source in the lower section. Using the wrong supply can damage the fixture or give a false reading.
Step 2: Open the sphere and place the fixture inside
We open the sphere and mount the fixture inside, so that all of its light stays in the sphere.
Step 3: Connect the fixture to the correct supply
The fixture is wired to the measurement cabinet. A low-voltage fixture connects to the low-voltage leads; a high-voltage fixture connects to the high-voltage leads.
Step 4: Close the sphere
Once the fixture is connected, we close the sphere completely, so no outside light gets in and no light from the fixture escapes.
Step 5: Set the voltage and current
When the instruments start, the power supply shows two values to set: voltage and current.
• Voltage is set to the fixture's rated voltage. For low-voltage fixtures, this is usually 24V.
• Current is calculated from the fixture's rated power: current = power ÷ voltage.
|
Rated power |
Rated voltage |
Current to set |
|---|---|---|
|
12W |
24V |
0.5A |
|
24W |
24V |
1A |
|
36W |
24V |
1.5A |
|
48W |
24V |
2A |
For a high-voltage fixture, we set the AC source to the fixture's rated mains voltage.
Step 6: Run the test and export the data
We start the test and let the fixture run until its light output is stable, because LED output changes as the fixture warms up. The spectroradiometer and power meter take their readings, and the results appear on the computer, where we export them as a test record.
What Data Does the Test Give You?
|
Value |
What it means for your project |
|---|---|
|
Luminous flux (lm) |
Total light output — the true brightness of the fixture |
|
Color temperature (CCT, K) |
How warm or cool the white light looks, e.g. 2700K, 3000K or 4000K |
|
Color tolerance (SDCM) |
How close the light is to its target color; a smaller number means more consistent color between fixtures |
|
Color rendering (CRI) |
How naturally colors appear under the light |
|
Voltage, current, power, power factor |
The fixture's real electrical performance |
|
Efficacy (lm/W) |
Lumens per watt — how efficiently the fixture turns power into light |
Testing RGB and RGBW Fixtures
For three-color (RGB) and four-color (RGBW) fixtures, the system can also measure the wavelength of each color channel and its efficacy. This confirms that the red, green and blue really are the colors specified, and helps keep color-changing facades consistent from fixture to fixture.
Why Color Tolerance Matters on a Facade
Color tolerance is measured in SDCM steps (MacAdam ellipses). When dozens of fixtures light the same wall, a large tolerance can make some sections look slightly pink and others slightly green. Many architectural projects specify a tight tolerance, such as 3 SDCM, so that every fixture on the facade looks the same.
Integrating Sphere vs Goniophotometer
Both instruments are accepted under IES LM-79, the North American standard for measuring LED products. The integrating sphere is fast and excellent for total lumens and color. A goniophotometer is slower but measures how light is distributed in every direction, which is what you need for an IES file and a lighting layout. Many projects need both.
See our article: Goniophotometer and IES Files Explained: What LM-79 Data Tells You
How to Read Integrating Sphere Results
• Check that the lumens are fixture lumens, not LED chip lumens. Chip lumens ignore losses from the lens, reflector and heat, so they are always higher than what the fixture really delivers.
• Compare efficacy, not just wattage. Two 50W fixtures can produce very different lumens.
• Look at color tolerance. On a facade, fixtures from different batches should sit close to the same color point.
• Match the model. The data should cover the exact wattage, CCT and optic in your order.
Our Integrating Sphere Testing Service
We have our own integrating sphere system in-house. If your project needs measured lumen, CCT, color tolerance or efficacy data — or wavelength data for RGB and RGBW fixtures — we can test the exact models and versions you plan to use and share the data for your project.
FAQ
Is an integrating sphere test the same as an LM-79 report?
An integrating sphere is one of the instruments used to produce LM-79 data. A full LM-79 report may also include goniophotometer data for light distribution.
Why is the current calculated from power and voltage?
For a fixture to be tested at its rated output, it must receive its rated voltage and current. Dividing the rated power by the rated voltage gives that current, for example 24W ÷ 24V = 1A.
Why do lumen numbers differ between suppliers?
Some quote LED chip lumens instead of fixture lumens, or measure before the fixture warms up. Always ask how the number was measured.
Can an integrating sphere test RGB fixtures?
Yes. It can measure the wavelength and efficacy of each color channel as well as the mixed output.
Need Verified Photometric Data?
Tell us about your project and we will recommend the right tests. Contact us for a free project consultation.
Back to the full guide: LED Light Fixture Testing: The Equipment and Reports That Prove Quality