Goniophotometer and IES Files Explained: What LM-79 Data Tells You
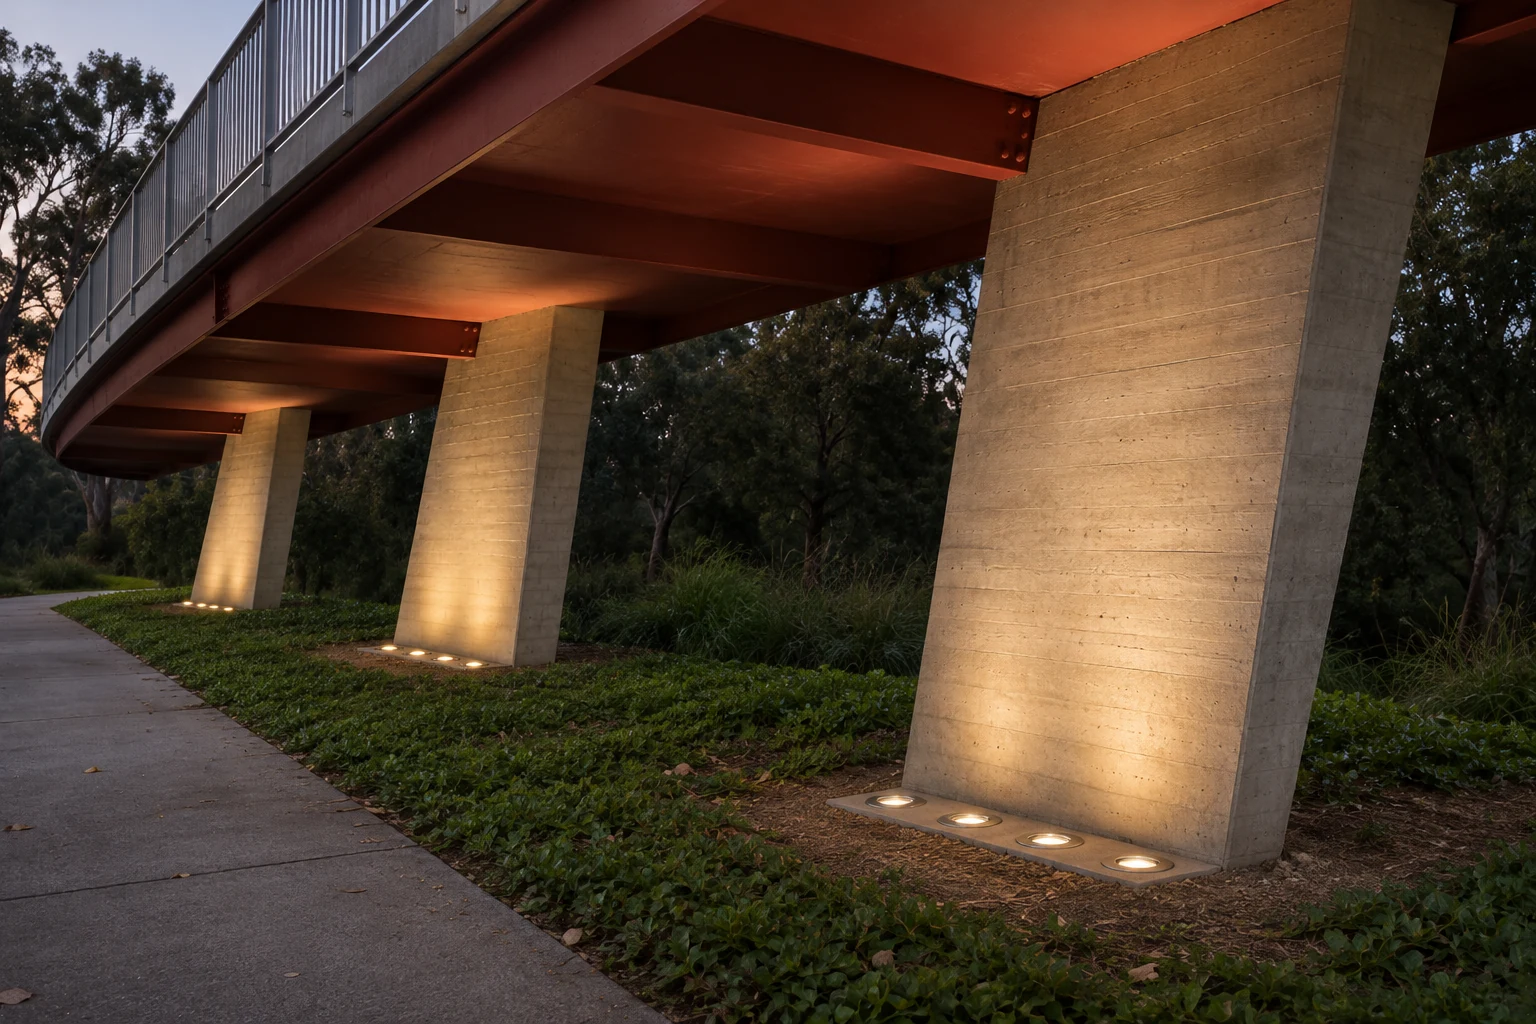
A lighting designer cannot plan a facade, a park or a bridge with lumens alone. They need to know where the light goes. That information comes from a goniophotometer and is delivered as an IES file. This article explains both, and how to use them when you choose fixtures for a project.
This article is part of our guide to LED Light Fixture Testing.
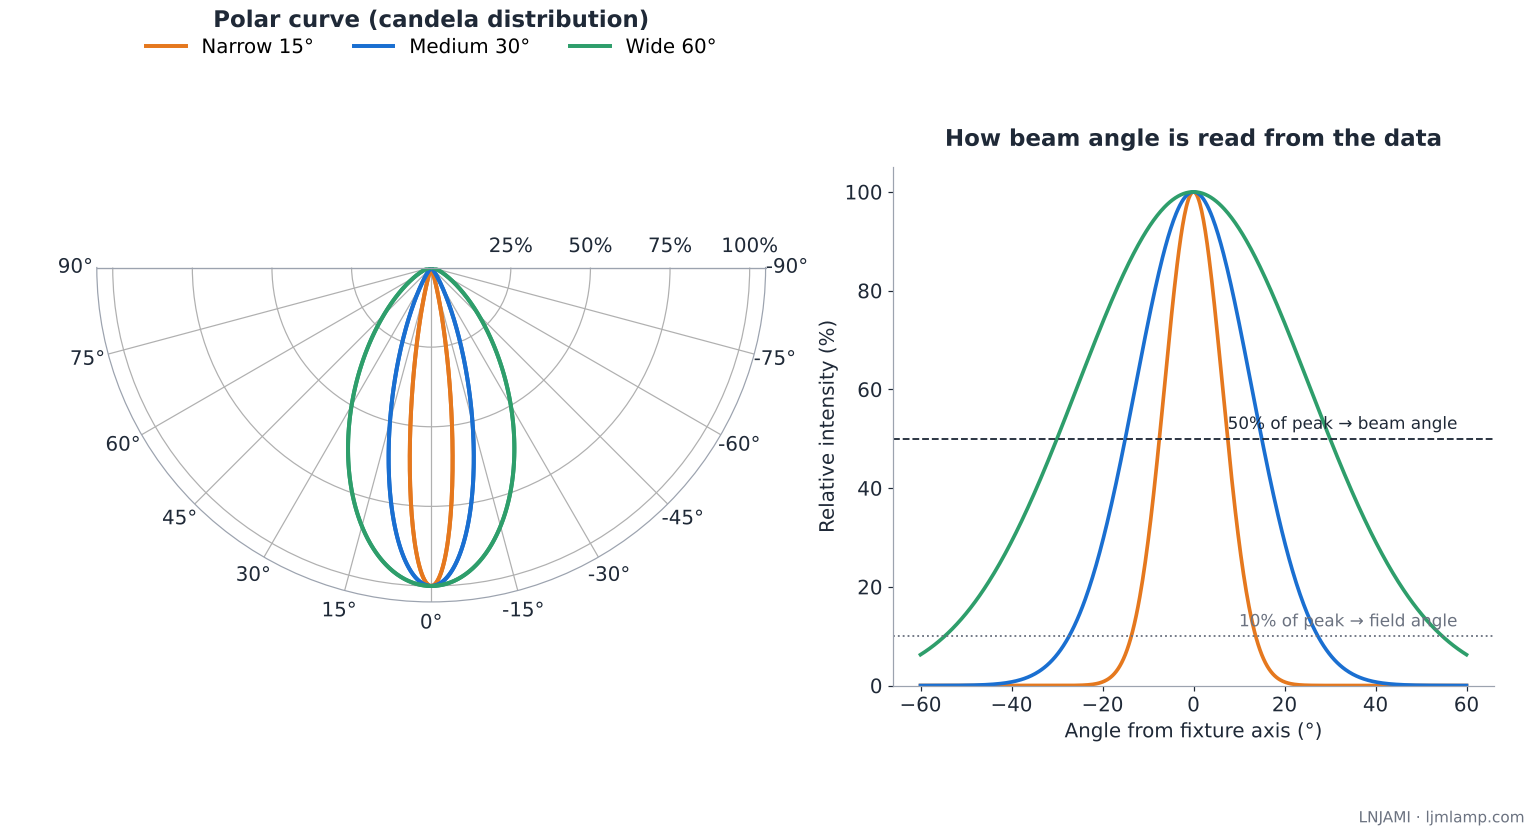
Left: polar curves of three beam angles. Right: how the beam angle (50% of peak) and field angle (10% of peak) are read from the measured intensity.
What Is a Goniophotometer?
A goniophotometer is an instrument that measures the light intensity of a fixture in every direction. It rotates the fixture, or moves a detector around it, through a grid of horizontal and vertical angles. At each angle it records the intensity in candela.
Put together, those readings form a complete 3D map of how the fixture spreads its light — its light distribution.
How Does It Work?
1. Mounting. The fixture is fixed to the rotating arm at its photometric center.
2. Stabilizing. It runs until light output and temperature are stable.
3. Scanning. The instrument steps through angles, often every 1° to 5°, recording intensity at each point.
4. Processing. Software combines the readings into total lumens, beam angle, polar curves and an IES file.
Different coordinate systems are used for different fixtures. Type C is common for general luminaires, while Type B is often used for floodlights and other narrow-beam projectors.
What Is an IES File?
An IES file is a small text file, in the IES LM-63 format, that stores the fixture's measured intensity at each angle. Lighting design software such as DIALux, AGi32 and Relux reads it and simulates exactly how that fixture will light a real wall, tree or road. In Europe, the equivalent format is LDT (EULUMDAT).
Without an accurate IES file, a lighting layout is a guess.
What the Data Tells You
|
Output |
What it means for your project |
|---|---|
|
Polar curve |
A 2D drawing of where the light goes and how strong it is |
|
Beam angle (and field angle) |
How wide the beam spreads; key for spacing wall washers and floodlights |
|
Peak intensity (cd) |
How far the light can throw, e.g. up a tall facade |
|
Total lumens |
Total output, consistent with integrating sphere data |
|
Isolux / isocandela diagrams |
Light levels on a surface at a given distance |
|
Glare and spill |
How much light goes where you don't want it |
Example: Reading a Real Goniophotometer Report
Below is the first page of a photometric test report for one of our fixtures: the XQ28, 24W, 24V, 3000K, with a 20° optic. It was measured on an EVERFINE GO-2000B goniophotometer.
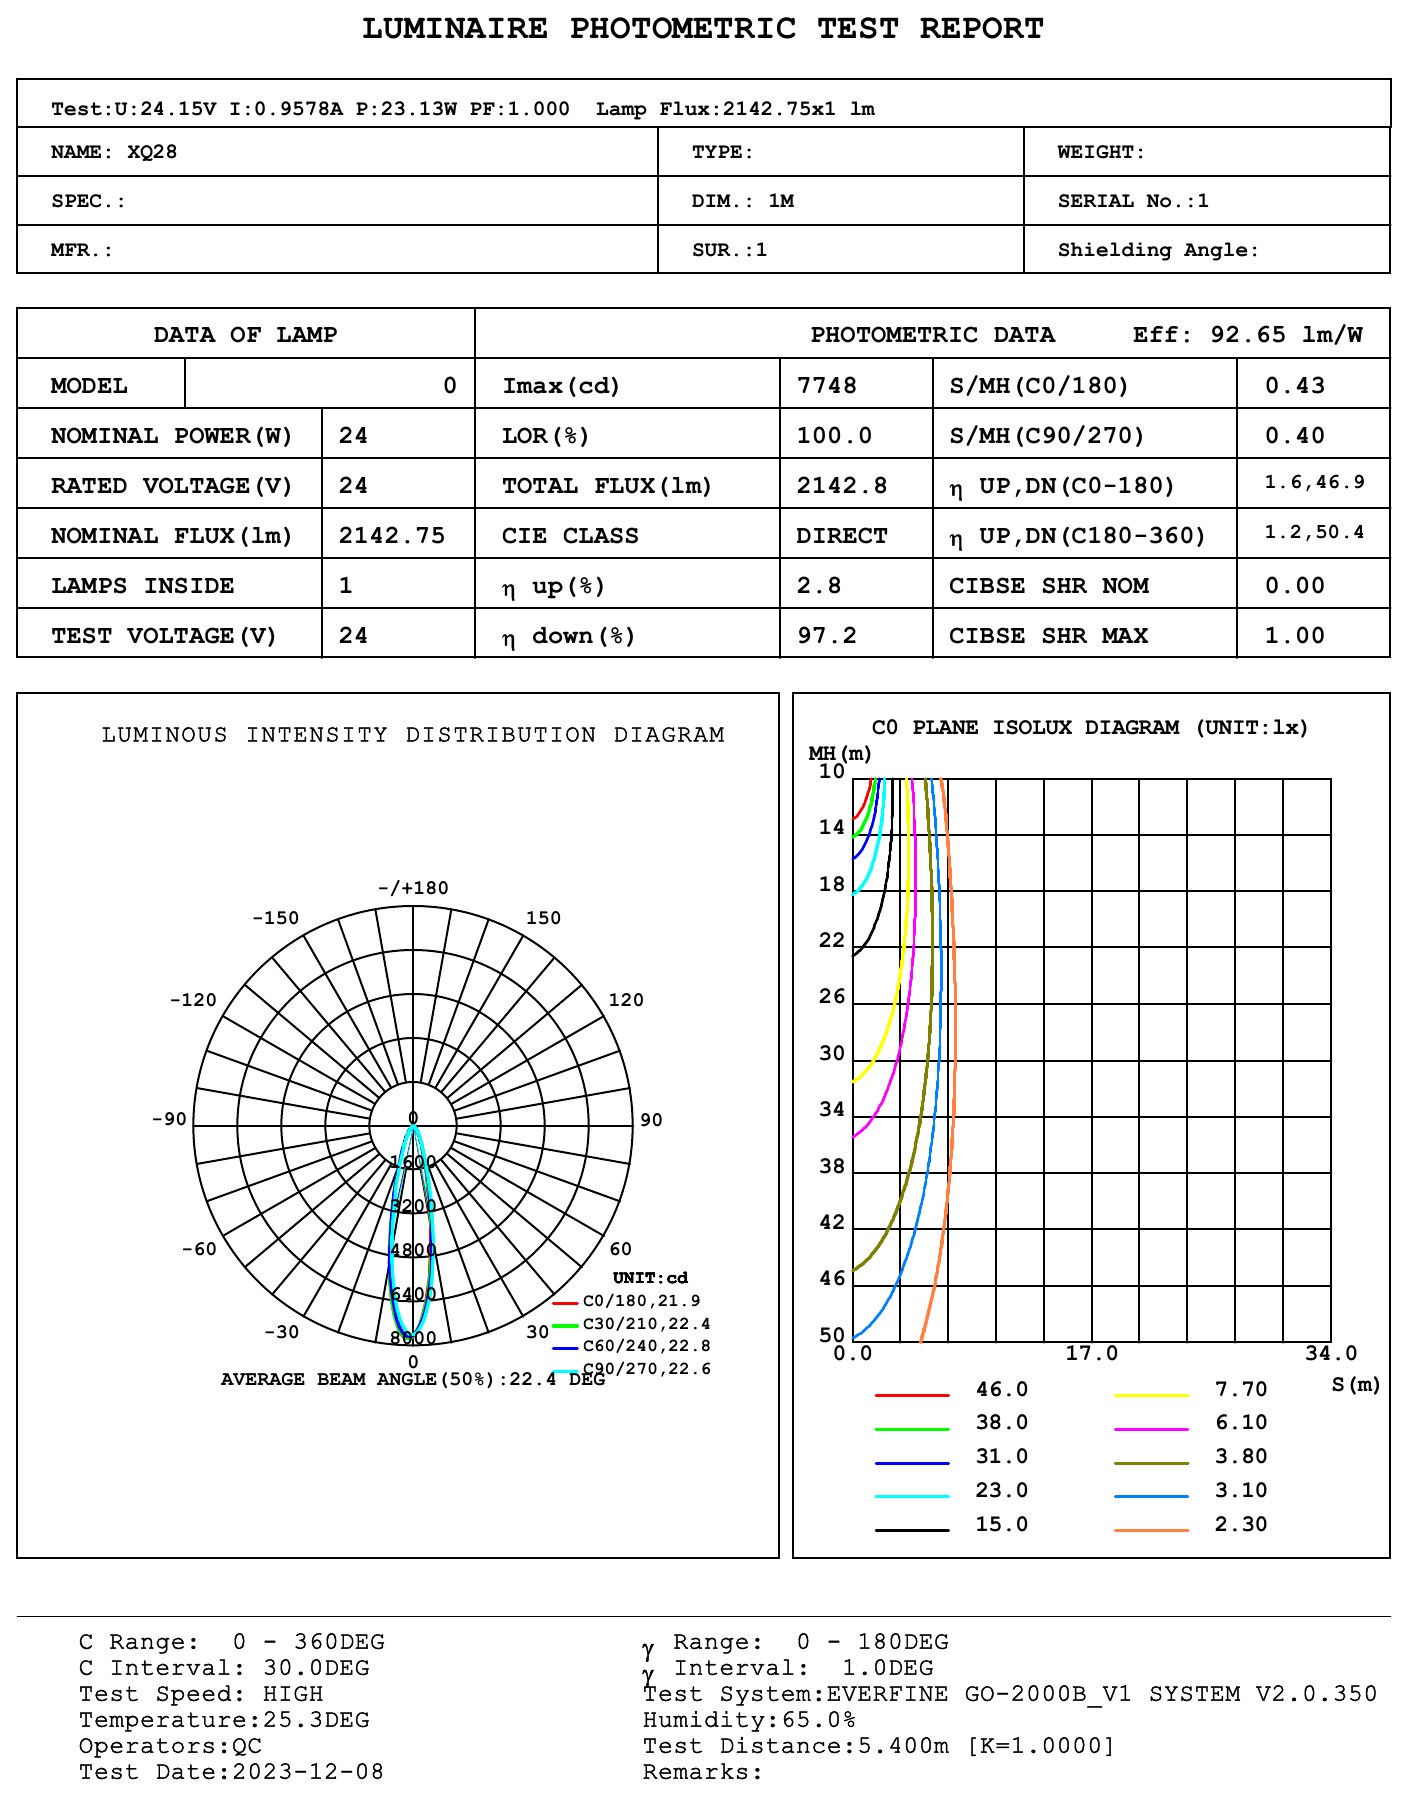
Page 1 of the XQ28 photometric test report: electrical data, photometric data, the polar curve and an isolux diagram.
|
Value in the report |
Result |
What it tells you |
|---|---|---|
|
Test voltage / current / power |
24.15V / 0.958A / 23.13W |
The fixture draws close to its rated 24W |
|
Power factor |
1.000 |
Clean power use at the measured input |
|
Total luminous flux |
2,142.8 lm |
The real light output of the complete fixture |
|
Efficacy |
92.65 lm/W |
Light output per watt, with the lens and optic in place |
|
Peak intensity (Imax) |
7,748 cd |
How far the light can throw — high for a narrow beam |
|
Average beam angle (50%) |
22.4° (21.9°–22.8° across C-planes) |
The measured beam width that design software will use |
|
Downward light (η down) |
97.2% |
Almost all the light goes where it is aimed |
|
Test conditions |
25.3 °C, test distance 5.4 m, 1° vertical steps |
How the measurement was made |
The beam-spread figure from the same report shows what this means on site: the size of the light spot and the average light level at different distances.
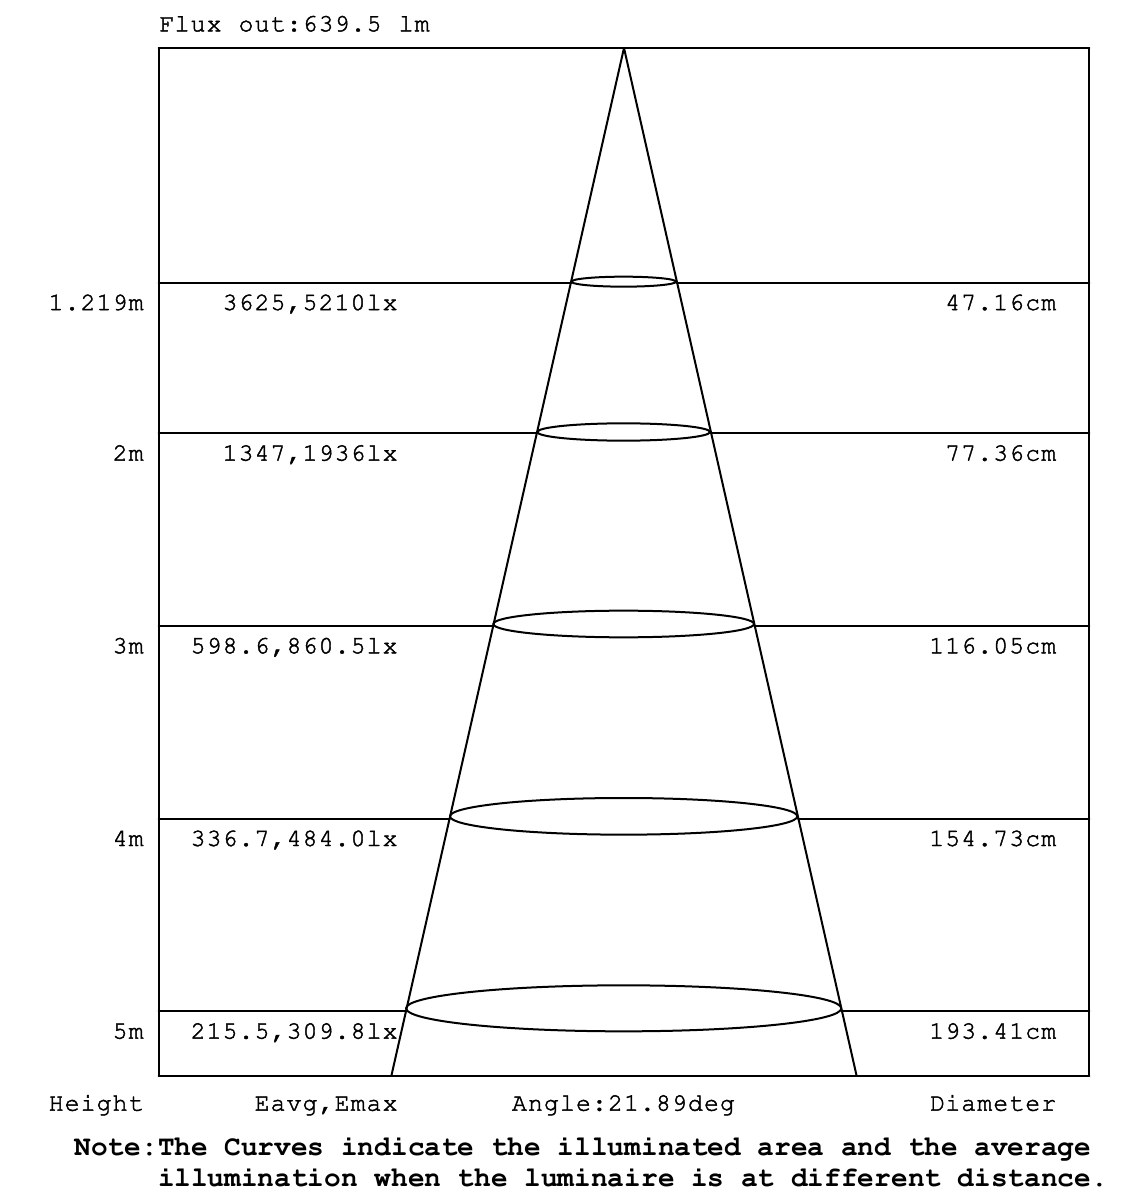
Beam spread of the XQ28: at 3 m the spot is about 1.16 m wide with an average of about 600 lux; at 5 m it is about 1.93 m wide with about 216 lux.
With this data, a lighting designer can check spacing and light levels before a single fixture is installed — and the IES file carries exactly these measured values into DIALux or AGi32.
What Is an LM-79 Report?
IES LM-79 is the North American standard method for measuring the electrical and photometric performance of solid-state lighting products. An LM-79 report combines electrical data with light output, color and distribution, using an integrating sphere, a goniophotometer, or both. Programs such as DLC and ENERGY STAR rely on LM-79 data.
For color and total lumens, see: What Is an Integrating Sphere? How LED Light Output Is Measured
How to Use IES Files When Choosing Fixtures
• Get a file for each optic. A 10°, 30° and 60° version of the same fixture have completely different IES files.
• Check the wattage and CCT match. The file should match the version in your order.
• Run the layout before you order. A simulation shows dark gaps, hot spots and spill on a facade before installation.
• Ask for the polar curve too. It lets you compare optics quickly without opening software.
Our IES Testing Service
LNJAMI has in-house equipment to produce IES photometric files, and we can provide IES files for the products and optics your project needs. If you need distribution data for a custom version, we can test it for you.
FAQ
Is an IES file the same as an LM-79 report?
No. The IES file is the light distribution data in a format software can read. An LM-79 report is the full test document, which may include the distribution data and much more.
Can I trust an IES file from a similar model?
Only as a rough guide. Optics, lens and housing all change the distribution, so use the file for the exact model.
Do I need IES files for a small project?
If the lighting has to look even, such as wall washing or facade grazing, a quick simulation is still worth it.
Need IES Files for Your Layout?
Send us your project details and the fixtures you are considering. Contact us for a free project consultation.
Back to the full guide: LED Light Fixture Testing: The Equipment and Reports That Prove Quality